Intramarket Difference Index StrategyHi Traders !!
The IDI Strategy:
In layman’s terms this strategy compares two indicators across markets and exploits their differences.
note: it is best the two markets are correlated as then we know we are trading a short to long term deviation from both markets' general trend with the assumption both markets will trend again sometime in the future thereby exhausting our trading opportunity.
📍 Import Notes:
This Strategy calculates trade position size independently (i.e. risk per trade is controlled in the user inputs tab), this means that the ‘Order size’ input in the ‘Properties’ tab will have no effect on the strategy. Why ? because this allows us to define custom position size algorithms which we can use to improve our risk management and equity growth over time. Here we have the option to have fixed quantity or fixed percentage of equity ATR (Average True Range) based stops in addition to the turtle trading position size algorithm.
‘Pyramiding’ does not work for this strategy’, similar to the order size input togeling this input will have no effect on the strategy as the strategy explicitly defines the maximum order size to be 1.
This strategy is not perfect, and as of writing of this post I have not traded this algo.
Always take your time to backtests and debug the strategy.
🔷 The IDI Strategy:
By default this strategy pulls data from your current TV chart and then compares it to the base market, be default BINANCE:BTCUSD . The strategy pulls SMA and RSI data from either market (we call this the difference data), standardizes the data (solving the different unit problem across markets) such that it is comparable and then differentiates the data, calling the result of this transformation and difference the Intramarket Difference (ID). The formula for the the ID is
ID = market1_diff_data - market2_diff_data (1)
Where
market(i)_diff_data = diff_data / ATR(j)_market(i)^0.5,
where i = {1, 2} and j = the natural numbers excluding 0
Formula (1) interpretation is the following
When ID > 0: this means the current market outperforms the base market
When ID = 0: Markets are at long run equilibrium
When ID < 0: this means the current market underperforms the base market
To form the strategy we define one of two strategy type’s which are Trend and Mean Revesion respectively.
🔸 Trend Case:
Given the ‘‘Strategy Type’’ is equal to TREND we define a threshold for which if the ID crosses over we go long and if the ID crosses under the negative of the threshold we go short.
The motivating idea is that the ID is an indicator of the two symbols being out of sync, and given we know volatility clustering, momentum and mean reversion of anomalies to be a stylised fact of financial data we can construct a trading premise. Let's first talk more about this premise.
For some markets (cryptocurrency markets - synthetic symbols in TV) the stylised fact of momentum is true, this means that higher momentum is followed by higher momentum, and given we know momentum to be a vector quantity (with magnitude and direction) this momentum can be both positive and negative i.e. when the ID crosses above some threshold we make an assumption it will continue in that direction for some time before executing back to its long run equilibrium of 0 which is a reasonable assumption to make if the market are correlated. For example for the BTCUSD - ETHUSD pair, if the ID > +threshold (inputs for MA and RSI based ID thresholds are found under the ‘‘INTRAMARKET DIFFERENCE INDEX’’ group’), ETHUSD outperforms BTCUSD, we assume the momentum to continue so we go long ETHUSD.
In the standard case we would exit the market when the IDI returns to its long run equilibrium of 0 (for the positive case the ID may return to 0 because ETH’s difference data may have decreased or BTC’s difference data may have increased). However in this strategy we will not define this as our exit condition, why ?
This is because we want to ‘‘let our winners run’’, to achieve this we define a trailing Donchian Channel stop loss (along with a fixed ATR based stop as our volatility proxy). If we were too use the 0 exit the strategy may print a buy signal (ID > +threshold in the simple case, market regimes may be used), return to 0 and then print another buy signal, and this process can loop may times, this high trade frequency means we fail capture the entire market move lowering our profit, furthermore on lower time frames this high trade frequencies mean we pay more transaction costs (due to price slippage, commission and big-ask spread) which means less profit.
By capturing the sum of many momentum moves we are essentially following the trend hence the trend following strategy type.
Here we also print the IDI (with default strategy settings with the MA difference type), we can see that by letting our winners run we may catch many valid momentum moves, that results in a larger final pnl that if we would otherwise exit based on the equilibrium condition(Valid trades are denoted by solid green and red arrows respectively and all other valid trades which occur within the original signal are light green and red small arrows).
another example...
Note: if you would like to plot the IDI separately copy and paste the following code in a new Pine Script indicator template.
indicator("IDI")
// INTRAMARKET INDEX
var string g_idi = "intramarket diffirence index"
ui_index_1 = input.symbol("BINANCE:BTCUSD", title = "Base market", group = g_idi)
// ui_index_2 = input.symbol("BINANCE:ETHUSD", title = "Quote Market", group = g_idi)
type = input.string("MA", title = "Differrencing Series", options = , group = g_idi)
ui_ma_lkb = input.int(24, title = "lookback of ma and volatility scaling constant", group = g_idi)
ui_rsi_lkb = input.int(14, title = "Lookback of RSI", group = g_idi)
ui_atr_lkb = input.int(300, title = "ATR lookback - Normalising value", group = g_idi)
ui_ma_threshold = input.float(5, title = "Threshold of Upward/Downward Trend (MA)", group = g_idi)
ui_rsi_threshold = input.float(20, title = "Threshold of Upward/Downward Trend (RSI)", group = g_idi)
//>>+----------------------------------------------------------------+}
// CUSTOM FUNCTIONS |
//<<+----------------------------------------------------------------+{
// construct UDT (User defined type) containing the IDI (Intramarket Difference Index) source values
// UDT will hold many variables / functions grouped under the UDT
type functions
float Close // close price
float ma // ma of symbol
float rsi // rsi of the asset
float atr // atr of the asset
// the security data
getUDTdata(symbol, malookback, rsilookback, atrlookback) =>
indexHighTF = barstate.isrealtime ? 1 : 0
= request.security(symbol, timeframe = timeframe.period,
expression = [close , // Instentiate UDT variables
ta.sma(close, malookback) ,
ta.rsi(close, rsilookback) ,
ta.atr(atrlookback) ])
data = functions.new(close_, ma_, rsi_, atr_)
data
// Intramerket Difference Index
idi(type, symbol1, malookback, rsilookback, atrlookback, mathreshold, rsithreshold) =>
threshold = float(na)
index1 = getUDTdata(symbol1, malookback, rsilookback, atrlookback)
index2 = getUDTdata(syminfo.tickerid, malookback, rsilookback, atrlookback)
// declare difference variables for both base and quote symbols, conditional on which difference type is selected
var diffindex1 = 0.0, var diffindex2 = 0.0,
// declare Intramarket Difference Index based on series type, note
// if > 0, index 2 outpreforms index 1, buy index 2 (momentum based) until equalibrium
// if < 0, index 2 underpreforms index 1, sell index 1 (momentum based) until equalibrium
// for idi to be valid both series must be stationary and normalised so both series hae he same scale
intramarket_difference = 0.0
if type == "MA"
threshold := mathreshold
diffindex1 := (index1.Close - index1.ma) / math.pow(index1.atr*malookback, 0.5)
diffindex2 := (index2.Close - index2.ma) / math.pow(index2.atr*malookback, 0.5)
intramarket_difference := diffindex2 - diffindex1
else if type == "RSI"
threshold := rsilookback
diffindex1 := index1.rsi
diffindex2 := index2.rsi
intramarket_difference := diffindex2 - diffindex1
//>>+----------------------------------------------------------------+}
// STRATEGY FUNCTIONS CALLS |
//<<+----------------------------------------------------------------+{
// plot the intramarket difference
= idi(type,
ui_index_1,
ui_ma_lkb,
ui_rsi_lkb,
ui_atr_lkb,
ui_ma_threshold,
ui_rsi_threshold)
//>>+----------------------------------------------------------------+}
plot(intramarket_difference, color = color.orange)
hline(type == "MA" ? ui_ma_threshold : ui_rsi_threshold, color = color.green)
hline(type == "MA" ? -ui_ma_threshold : -ui_rsi_threshold, color = color.red)
hline(0)
Note it is possible that after printing a buy the strategy then prints many sell signals before returning to a buy, which again has the same implication (less profit. Potentially because we exit early only for price to continue upwards hence missing the larger "trend"). The image below showcases this cenario and again, by allowing our winner to run we may capture more profit (theoretically).
This should be clear...
🔸 Mean Reversion Case:
We stated prior that mean reversion of anomalies is an standerdies fact of financial data, how can we exploit this ?
We exploit this by normalizing the ID by applying the Ehlers fisher transformation. The transformed data is then assumed to be approximately normally distributed. To form the strategy we employ the same logic as for the z score, if the FT normalized ID > 2.5 (< -2.5) we buy (short). Our exit conditions remain unchanged (fixed ATR stop and trailing Donchian Trailing stop)
🔷 Position Sizing:
If ‘‘Fixed Risk From Initial Balance’’ is toggled true this means we risk a fixed percentage of our initial balance, if false we risk a fixed percentage of our equity (current balance).
Note we also employ a volatility adjusted position sizing formula, the turtle training method which is defined as follows.
Turtle position size = (1/ r * ATR * DV) * C
Where,
r = risk factor coefficient (default is 20)
ATR(j) = risk proxy, over j times steps
DV = Dollar Volatility, where DV = (1/Asset Price) * Capital at Risk
🔷 Risk Management:
Correct money management means we can limit risk and increase reward (theoretically). Here we employ
Max loss and gain per day
Max loss per trade
Max number of consecutive losing trades until trade skip
To read more see the tooltips (info circle).
🔷 Take Profit:
By defualt the script uses a Donchain Channel as a trailing stop and take profit, In addition to this the script defines a fixed ATR stop losses (by defualt, this covers cases where the DC range may be to wide making a fixed ATR stop usefull), ATR take profits however are defined but optional.
ATR SL and TP defined for all trades
🔷 Hurst Regime (Regime Filter):
The Hurst Exponent (H) aims to segment the market into three different states, Trending (H > 0.5), Random Geometric Brownian Motion (H = 0.5) and Mean Reverting / Contrarian (H < 0.5). In my interpretation this can be used as a trend filter that eliminates market noise.
We utilize the trending and mean reverting based states, as extra conditions required for valid trades for both strategy types respectively, in the process increasing our trade entry quality.
🔷 Example model Architecture:
Here is an example of one configuration of this strategy, combining all aspects discussed in this post.
Future Updates
- Automation integration (next update)
"stop loss" için komut dosyalarını ara

Multi-Factor StrategyThis trading strategy combines multiple technical indicators to create a systematic approach for entering and exiting trades. The goal is to capture trends by aligning several key indicators to confirm the direction and strength of a potential trade. Below is a detailed description of how the strategy works:
Indicators Used
MACD (Moving Average Convergence Divergence):
MACD Line: The difference between the 12-period and 26-period Exponential Moving Averages (EMAs).
Signal Line: A 9-period EMA of the MACD line.
Usage: The strategy looks for crossovers between the MACD line and the Signal line as entry signals. A bullish crossover (MACD line crossing above the Signal line) indicates a potential upward movement, while a bearish crossover (MACD line crossing below the Signal line) signals a potential downward movement.
RSI (Relative Strength Index):
Usage: RSI is used to gauge the momentum of the price movement. The strategy uses specific thresholds: below 70 for long positions to avoid overbought conditions and above 30 for short positions to avoid oversold conditions.
ATR (Average True Range):
Usage: ATR measures market volatility and is used to set dynamic stop-loss and take-profit levels. A stop loss is set at 2 times the ATR, and a take profit at 3 times the ATR, ensuring that risk is managed relative to market conditions.
Simple Moving Averages (SMA):
50-day SMA: A short-term trend indicator.
200-day SMA: A long-term trend indicator.
Usage: The strategy uses the relationship between the 50-day and 200-day SMAs to determine the overall market trend. Long positions are taken when the price is above the 50-day SMA and the 50-day SMA is above the 200-day SMA, indicating an uptrend. Conversely, short positions are taken when the price is below the 50-day SMA and the 50-day SMA is below the 200-day SMA, indicating a downtrend.
Entry Conditions
Long Position:
-MACD Crossover: The MACD line crosses above the Signal line.
-RSI Confirmation: RSI is below 70, ensuring the asset is not overbought.
-SMA Confirmation: The price is above the 50-day SMA, and the 50-day SMA is above the 200-day SMA, indicating a strong uptrend.
Short Position:
MACD Crossunder: The MACD line crosses below the Signal line.
RSI Confirmation: RSI is above 30, ensuring the asset is not oversold.
SMA Confirmation: The price is below the 50-day SMA, and the 50-day SMA is below the 200-day SMA, indicating a strong downtrend.
Opposite conditions for shorts
Exit Strategy
Stop Loss: Set at 2 times the ATR from the entry price. This dynamically adjusts to market volatility, allowing for wider stops in volatile markets and tighter stops in calmer markets.
Take Profit: Set at 3 times the ATR from the entry price. This ensures a favorable risk-reward ratio of 1:1.5, aiming for higher rewards on successful trades.
Visualization
SMAs: The 50-day and 200-day SMAs are plotted on the chart to visualize the trend direction.
MACD Crossovers: Bullish and bearish MACD crossovers are highlighted on the chart to identify potential entry points.
Summary
This strategy is designed to align multiple indicators to increase the probability of successful trades by confirming trends and momentum before entering a position. It systematically manages risk with ATR-based stop loss and take profit levels, ensuring that trades are exited based on market conditions rather than arbitrary points. The combination of trend indicators (SMAs) with momentum and volatility indicators (MACD, RSI, ATR) creates a robust approach to trading in various market environments.

Zero-lag TEMA Crosses Strategy[Pakun]Here's the adjusted strategy description in English, aligned with the house rules:
---
### Strategy Name: Zero-lag TEMA Cross Strategy
**Purpose:** This strategy aims to identify entry and exit points in the market using Zero-lag Triple Exponential Moving Averages (TEMA). It focuses on minimizing lag and improving the accuracy of trend-following signals.
### Uniqueness and Usefulness
**Uniqueness:** This strategy employs the less commonly used Zero-lag TEMA, compared to standard moving averages. This unique approach reduces lag and provides more timely signals.
**Usefulness:** This strategy is valuable for traders looking to capture trend reversals or continuations with reduced lag. It has the potential to enhance the profitability and accuracy of trades.
### Entry Conditions
**Long Entry:**
- **Condition:** A crossover occurs where the short-term Zero-lag TEMA surpasses the long-term Zero-lag TEMA.
- **Signal:** A buy signal is generated, indicating a potential uptrend.
**Short Entry:**
- **Condition:** A crossunder occurs where the short-term Zero-lag TEMA falls below the long-term Zero-lag TEMA.
- **Signal:** A sell signal is generated, indicating a potential downtrend.
### Exit Conditions
**Exit Strategy:**
- **Stop Loss:** Positions are closed if the price moves against the trade and hits the predefined stop loss level. The stop loss is set based on recent highs/lows.
- **Take Profit:** Positions are closed when the price reaches the profit target. The profit target is calculated as 1.5 times the distance between the entry price and the stop loss level.
### Risk Management
**Risk Management Rules:**
- This strategy incorporates a dynamic stop loss mechanism based on recent highs/lows over a specified period.
- The take profit level ensures a reward-to-risk ratio of 1.5 times the stop loss distance.
- These measures aim to manage risk and protect capital.
**Account Size:** ¥500,000
**Commissions and Slippage:** 94 pips per trade and 1 pip slippage
**Risk per Trade:** 1% of account equity
### Configurable Options
**Configurable Options:**
- Lookback Period: The number of bars to calculate recent highs/lows.
- Fast Period: Length of the short-term Zero-lag TEMA (69).
- Slow Period: Length of the long-term Zero-lag TEMA (130).
- Signal Display: Option to display buy/sell signals on the chart.
- Bar Color: Option to change bar colors based on trend direction.
### Adequate Sample Size
**Sample Size Justification:**
- To ensure the robustness and reliability of the strategy, it should be tested with a sufficiently long period of historical data.
- It is recommended to backtest across multiple market cycles to adapt to different market conditions.
- This strategy was backtested using 10 days of historical data, including 184 trades.
### Notes
**Additional Considerations:**
- This strategy is designed for educational purposes and should be thoroughly tested in a demo environment before live trading.
- Settings should be adjusted based on the asset being traded and current market conditions.
### Credits
**Acknowledgments:**
- The concept and implementation of Zero-lag TEMA are based on contributions from technical analysts and the trading community.
- Special thanks to John Doe for the TEMA concept.
- Thanks to Zero-lag TEMA Crosses .
- This strategy has been enhanced by adding new filtering algorithms and risk management rules to the original TEMA code.
### Clean Chart Description
**Chart Appearance:**
- This strategy provides a clean and informative chart by plotting Zero-lag TEMA lines and optional entry/exit signals.
- The display of signals and color bars can be toggled to declutter the chart, improving readability and analysis.

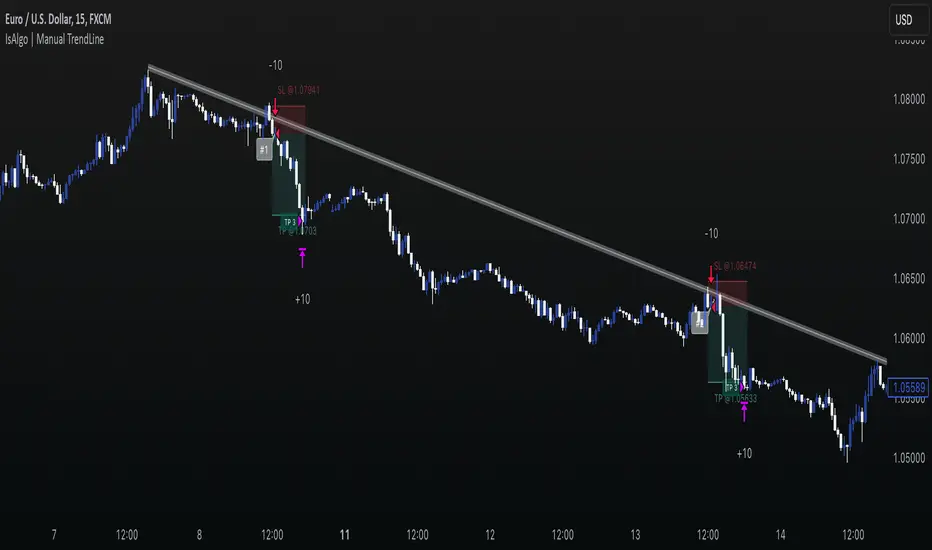
IsAlgo - Manual TrendLine► Overview:
Manual TrendLine is a strategy that allows traders to manually insert a trendline and opens trades when the trendline is retested or when the price hits a new highest high or lowest low. It provides flexibility in trendline configuration and trading behavior, enabling responsive and adaptable trading strategies.
► Description:
The Manual TrendLine strategy revolves around using manually defined trendlines as the primary tool for making trading decisions. Traders start by specifying two key points on the chart to establish the trendline. Each point is defined by a specific time and price, enabling precise placement according to the trader’s analysis and insights. Additionally, the strategy allows for the adjustment of the trendline’s width, which acts as a buffer zone around the trendline, providing flexibility in how closely price movements must align with the trendline to trigger trades.
Once the trendline is established, the strategy continuously monitors price movements relative to this line. One of its core functions is to execute trades when the price retests the trendline. A retest occurs when the price approaches the trendline after initially diverging from it, indicating potential continuation of the prevailing trend. This behavior is often seen as a confirmation of the trend’s strength, and the strategy takes advantage of these moments to enter trades in the direction of the trend.
Beyond retests, the strategy also tracks the formation of new highest highs and lowest lows in relation to the trendline. When the price reaches a new highest high or lowest low, it signifies strong momentum in the trend’s direction. The strategy can be configured to open trades at these critical points.
Another key feature of the strategy is its response to trendline breaks. A break occurs when the price moves through the trendline, potentially signaling a reversal or a significant shift in market sentiment. The strategy can be set to open reverse trades upon such breaks, enabling traders to quickly adapt to changing market conditions. Additionally, traders have the option to stop opening new trades after a trendline break, helping to avoid trades during periods of uncertainty or increased volatility.
↑ Up Trend Example:
↓ Down Trend Example:
► Features and Settings:
⚙︎ TrendLine: Define the time and price of the two main points of the trendline, and set the trendline width.
⚙︎ Entry Candle: Specify the minimum and maximum body size and the body-to-candle size ratio for entry candles.
⚙︎ Trading Session: Define specific trading hours during which the strategy operates, restricting trades to preferred market periods.
⚙︎ Trading Days: Specify active trading days to avoid certain days of the week.
⚙︎ Backtesting: backtesting for a selected period to evaluate strategy performance. This feature can be deactivated if not needed.
⚙︎ Trades: Configure trade direction (long, short, or both), position sizing (fixed or percentage-based), maximum number of open trades, and daily trade limits.
⚙︎ Trades Exit: Set profit/loss limits, specify trade duration, or exit based on band reversal signals.
⚙︎ Stop Loss: Choose from various stop-loss methods, including fixed pips, ATR-based, or highest/lowest price points within a specified number of candles. Trades can also be closed after a certain number of adverse candle movements.
⚙︎ Break Even: Adjust stop loss to break even once predefined profit levels are reached, protecting gains.
⚙︎ Trailing Stop: Implement a trailing stop to adjust the stop loss as the trade becomes profitable, securing gains and potentially capturing further upside.
⚙︎ Take Profit: Set up to three take-profit levels using methods such as fixed pips, ATR, or risk-to-reward ratios. Alternatively, specify a set number of candles moving in the trade’s direction.
⚙︎ Alerts: Comprehensive alert system to notify users of significant actions, including trade openings and closings. Supports dynamic placeholders for take-profit levels and stop-loss prices.
⚙︎ Dashboard: Visual display on the chart providing detailed information about ongoing and past trades, aiding users in monitoring strategy performance and making informed decisions.
► Backtesting Details:
Timeframe: 30-minute EURUSD chart
Initial Balance: $10,000
Order Size: 500 units
Commission: 0.05%
Slippage: 5 ticks
This strategy opens trades around a manually drawn trendline, which results in a smaller number of closed trades.
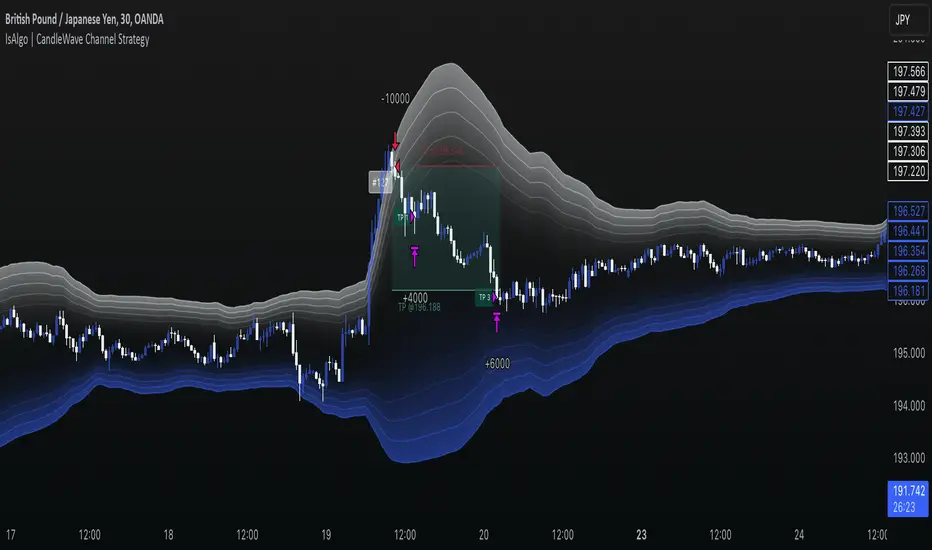
IsAlgo - CandleWave Channel Strategy► Overview:
The CandleWave Channel Strategy uses an exponential moving average (EMA) combined with a custom true range function to dynamically calculate a multi-level price channel, helping traders identify potential trend reversals and price pullbacks.
► Description:
The CandleWave Channel Strategy is built around an EMA designed to identify potential reversal points in the market. The channel’s main points are calculated using this EMA, which serves as the foundation for the strategy’s dynamic price channel. The channel edges are determined using a proprietary true range function that measures the distance between the highs and lows of price movements over a specific period. By factoring in the maximum distance between highs and lows and averaging these values over the period, the strategy creates a responsive channel that adapts to current market conditions. The channel consists of five levels, each representing different degrees of trend tension.
The strategy continuously monitors the price in relation to the channel edges. When a candle closes outside one of these edges, it indicates a potential price reversal. This outside-close candle acts as a signal for a possible trend change, prompting the strategy to prepare for a trade entry. Upon detecting an outside-close candle, the strategy triggers an entry. The logic behind this is that when the price moves outside the defined channel, it is likely to revert back within the channel and move towards the opposite edge. The strategy aims to capitalize on this reversion by entering trades based on these signals.
Traders can adjust the channel’s length, levels, and minimum distance to tailor it to different market conditions. They can also define the characteristics of the entry candle, such as its size, body, and relative position to previous candles, to ensure it meets specific conditions before triggering a trade. Additionally, the strategy permits the specification of trading hours and days, enabling traders to focus on preferred market periods. Exit can be configured based on profit/loss limits, trade duration, and band reversal signals or other criteria.
How it Works:
Channel Calculation: The strategy continuously updates the channel edges using the EMA and true range function.
Signal Detection: It waits for a candle to close outside the channel edges.
Trade Entry: When an outside-close candle is detected, the strategy enters a trade expecting the price to revert to the opposite channel edge.
Customization: Users can define the characteristics of the entry candle, such as its size relative to previous candles, to ensure it meets specific conditions before triggering a trade.
↑ Long Trade Example:
The entry candle closes below the channel level, indicating a potential upward reversal. The strategy enters a long position expecting the price to move towards the upper levels.
↓ Short Trade Example:
The entry candle closes above the channel level, signaling a potential downward reversal. The strategy enters a short position anticipating the price to revert towards the lower levels.
► Features and Settings:
⚙︎ Channel: Adjust the channel’s length, levels, and minimum distance to suit different market conditions and trading styles.
⚙︎ Entry Candle: Customize entry criteria, including candle size, body, and relative position to previous candles for accurate signal generation.
⚙︎ Trading Session: Define specific trading hours during which the strategy operates, restricting trades to preferred market periods.
⚙︎ Trading Days: Specify active trading days to avoid certain days of the week.
⚙︎ Backtesting: backtesting for a selected period to evaluate strategy performance. This feature can be deactivated if not needed.
⚙︎ Trades: Configure trade direction (long, short, or both), position sizing (fixed or percentage-based), maximum number of open trades, and daily trade limits.
⚙︎ Trades Exit: Set profit/loss limits, specify trade duration, or exit based on band reversal signals.
⚙︎ Stop Loss: Choose from various stop-loss methods, including fixed pips, ATR-based, or highest/lowest price points within a specified number of candles. Trades can also be closed after a certain number of adverse candle movements.
⚙︎ Break Even: Adjust stop loss to break even once predefined profit levels are reached, protecting gains.
⚙︎ Trailing Stop: Implement a trailing stop to adjust the stop loss as the trade becomes profitable, securing gains and potentially capturing further upside.
⚙︎ Take Profit: Set up to three take-profit levels using methods such as fixed pips, ATR, or risk-to-reward ratios. Alternatively, specify a set number of candles moving in the trade’s direction.
⚙︎ Alerts: Comprehensive alert system to notify users of significant actions, including trade openings and closings. Supports dynamic placeholders for take-profit levels and stop-loss prices.
⚙︎ Dashboard: Visual display on the chart providing detailed information about ongoing and past trades, aiding users in monitoring strategy performance and making informed decisions.
► Backtesting Details:
Timeframe: 30-minute GBPJPY chart
Initial Balance: $10,000
Order Size: 500 units
Commission: 0.02%
Slippage: 5 ticks
Double Vegas SuperTrend Enhanced - Strategy [presentTrading]
█ Introduction and How It Is Different
The "Double Vegas SuperTrend Enhanced" strategy is a sophisticated trading system that combines two Vegas SuperTrend Enhanced. Very Powerful!
Let's celebrate the joy of Children's Day on June 1st! Enjoyyy!
BTCUSD LS performance
The strategy aims to pinpoint market trends with greater accuracy and generate trades that align with the overall market direction.
This approach differentiates itself by integrating volatility adjustments and leveraging the Vegas Channel's width to refine the SuperTrend calculations, resulting in a dynamic and responsive trading system.
Additionally, the strategy incorporates customizable take-profit and stop-loss levels, providing traders with a robust framework for risk management.
-> check Vegas SuperTrend Enhanced - Strategy
█ Strategy, How It Works: Detailed Explanation
🔶 Vegas Channel and SuperTrend Calculations
The strategy initiates by calculating the Vegas Channel, which is derived from a simple moving average (SMA) and the standard deviation (STD) of the closing prices over a specified window length. This channel helps in measuring market volatility and forms the basis for adjusting the SuperTrend indicator.
Vegas Channel Calculation:
- vegasMovingAverage = SMA(close, vegasWindow)
- vegasChannelStdDev = STD(close, vegasWindow)
- vegasChannelUpper = vegasMovingAverage + vegasChannelStdDev
- vegasChannelLower = vegasMovingAverage - vegasChannelStdDev
SuperTrend Multiplier Adjustment:
- channelVolatilityWidth = vegasChannelUpper - vegasChannelLower
- adjustedMultiplier = superTrendMultiplierBase + volatilityAdjustmentFactor * (channelVolatilityWidth / vegasMovingAverage)
The adjusted multiplier enhances the SuperTrend's sensitivity to market volatility, making it more adaptable to changing market conditions.
BTCUSD Local picture.
🔶 Average True Range (ATR) and SuperTrend Values
The ATR is computed over a specified period to measure market volatility. Using the ATR and the adjusted multiplier, the SuperTrend upper and lower levels are determined.
ATR Calculation:
- averageTrueRange = ATR(atrPeriod)
**SuperTrend Calculation:**
- superTrendUpper = hlc3 - (adjustedMultiplier * averageTrueRange)
- superTrendLower = hlc3 + (adjustedMultiplier * averageTrueRange)
The SuperTrend levels are continuously updated based on the previous values and the current market trend direction. The market trend is determined by comparing the closing prices with the SuperTrend levels.
Trend Direction:
- If close > superTrendLowerPrev, then marketTrend = 1 (bullish)
- If close < superTrendUpperPrev, then marketTrend = -1 (bearish)
🔶 Trade Entry and Exit Conditions
The strategy generates trade signals based on the alignment of both SuperTrends. Trades are executed only when both SuperTrends indicate the same market direction.
Entry Conditions:
- Long Position: Both SuperTrends must signal a bullish trend.
- Short Position: Both SuperTrends must signal a bearish trend.
Exit Conditions:
- Positions are exited if either SuperTrend reverses its trend direction.
- Additional conditions include holding periods and configurable take-profit and stop-loss levels.
█ Trade Direction
The strategy allows traders to specify the desired trade direction through a customizable input setting. Options include:
- Long: Only enter long positions.
- Short: Only enter short positions.
- Both: Enter both long and short positions based on the market conditions.
█ Usage
To utilize the "Double Vegas SuperTrend Enhanced" strategy, traders need to configure the input settings according to their trading preferences and market conditions. The strategy includes parameters for ATR periods, Vegas Channel window lengths, SuperTrend multipliers, volatility adjustment factors, and risk management settings such as hold days, take-profit, and stop-loss percentages.
█ Default Settings
The strategy comes with default settings that can be adjusted to fit individual trading styles:
- trade Direction: Both (allows trading in both long and short directions for maximum flexibility).
- ATR Periods: 10 for SuperTrend 1 and 5 for SuperTrend 2 (shorter ATR period results in more sensitivity to recent price movements).
- Vegas Window Lengths: 100 for SuperTrend 1 and 200 for SuperTrend 2 (longer window length results in smoother moving averages and less sensitivity to short-term volatility).
- SuperTrend Multipliers: 5 for SuperTrend 1 and 7 for SuperTrend 2 (higher multipliers lead to wider SuperTrend channels, reducing the frequency of trades).
- Volatility Adjustment Factors: 5 for SuperTrend 1 and 7 for SuperTrend 2 (higher adjustment factors increase the responsiveness to changes in market volatility).
- Hold Days: 5 (defines the minimum duration a position is held, ensuring trades are not exited prematurely).
- Take Profit: 30% (sets the target profit level to lock in gains).
- Stop Loss: 20% (sets the maximum acceptable loss level to mitigate risk).

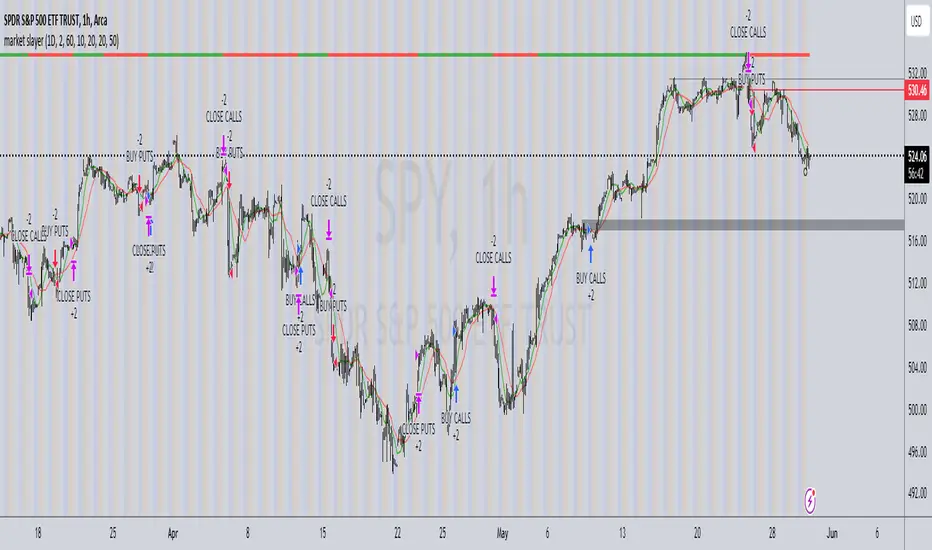
market slayerInput Parameters:
Various input parameters allow customization of the strategy, including options to show trend confirmation, specify trend timeframes and values, set SMA lengths, enable take profit and stop loss, and define their respective values.
Calculations:
Simple Moving Averages (SMAs) are calculated based on the specified lengths.
Buy and sell signals are generated based on the crossover and crossunder of the short and long SMAs.
Confirmation Bars:
Functions are defined to determine bullish or bearish confirmation bars based on certain conditions.
These confirmation bars are used to confirm trend direction and generate additional signals.
Plotting:
SMAs are plotted on the chart.
Trend labels and signal markers are plotted based on the calculated conditions.
Trade Signals:
Buy and sell conditions are defined based on the crossover/crossunder of SMAs and confirmation of trend direction.
Strategy entries and exits are executed accordingly.
Take Profit and Stop Loss:
Optional take profit and stop loss functionality is included.
Trades are automatically closed when profit or loss thresholds are reached.
Closing Trades:
Trades are also closed based on changes in trend confirmation bars to ensure alignment with the overall market direction.
Alerts:
Alert conditions are defined for opening and closing trades, providing notifications when certain conditions are met.
Overall, this script aims to provide a systematic approach to trading by combining moving average crossovers with trend confirmation bars, along with options for risk management through take profit and stop loss orders. Users can customize various parameters to adapt the strategy to different market conditions and trading preferences.
The script uses the request.security() function with the lookahead parameter set to barmerge.lookahead_on to access data from a higher timeframe within the Pine Script on TradingView. Let's break down why it's used:
Higher Timeframe Analysis:
By default, Pine Script operates on the timeframe of the chart it's applied to. However, in trading strategies, it's common to incorporate signals or data from higher timeframes to confirm or validate signals generated on lower timeframes. This helps traders to align their trades with the broader market trend.
Trend Confirmation:
In this script, the confirmationTrendTimeframe parameter allows users to specify a higher timeframe for trend confirmation. The request.security() function fetches the data from this higher timeframe and applies the defined conditions to confirm the trend direction.
Lookahead Behavior:
The lookahead parameter set to barmerge.lookahead_on ensures that the script considers the most up-to-date information available on the higher timeframe when making trading decisions on the lower timeframe. This prevents the script from lagging behind or using outdated data, enhancing the accuracy of trend confirmation.
Usage in confirmationTrendBullish and confirmationTrendBearish:
These variables are assigned the values returned by the request.security() function, which represents the bullish or bearish trend confirmation based on the conditions applied to the data from the higher timeframe.
Trend Crawler with Dynamic TP and Trailing Stop### Description of "Trend Crawler with Dynamic TP and Trailing Stop"
#### Overview
The "Trend Crawler with Dynamic TP and Trailing Stop" is a comprehensive trading strategy designed for medium-frequency trading on various timeframes and markets. It utilizes a combination of trend identification and volatility analysis to determine optimal entry and exit points, aiming to maximize profitability by adapting to changing market conditions.
#### Strategy Mechanics
1. **Moving Averages**: Users can select between Simple Moving Average (SMA) and Exponential Moving Average (EMA) to define the trend. The strategy uses two moving averages (fast and slow) to identify the trend direction. A crossover of the fast MA above the slow MA signals a potential bullish trend, while a crossunder signals a bearish trend.
2. **Volume Analysis**: The strategy incorporates volume analysis to confirm the strength of the trend. It calculates a standard deviation of volume from its moving average to detect significant increases in trading activity, which supports the trend direction indicated by the MAs.
3. **Price Spread and RSI**: It uses the price spread (difference between the close and open of each bar) and the Relative Strength Index (RSI) to filter entries based on market momentum and overbought/oversold conditions. This helps in refining the entries to avoid weak or overly extended moves.
4. **Dynamic Take Profit and Trailing Stop**:
- **Trailing Stop**: As the position moves into profit, the strategy adjusts the stop loss dynamically to protect gains, using a trailing stop mechanism.
- **Dynamic Take Profit**: The take profit levels are adjusted based on the volatility (measured by the standard deviation of the price spread) to capture maximum profit from significant moves.
#### Usage
To use the strategy:
- Set the desired moving average type and lengths according to the asset and timeframe being traded.
- Adjust the RSI thresholds to match the market's volatility and trading style.
- Set the base take profit and stop loss levels along with the trailing stop distance based on risk tolerance and trading objectives.
#### Justification for Originality
While the use of moving averages, RSI, and volume analysis may be common, the integration of these elements with dynamic adjustments for take profit and trailing stops based on real-time volatility analysis offers a unique approach. The strategy adapts not just to trend direction but also to the market's momentum and volatility, providing a tailored trading solution that goes beyond standard indicator-based strategies.
#### Strategy Results and Settings
Backtesting should be conducted with realistic account sizes and include considerations for commission and slippage to ensure that the results are not misleading. Risk per trade should be kept within a sustainable range (ideally less than 5% of account equity), and the strategy should be tested over a sufficient sample size (at least 100 trades) to validate its effectiveness.
#### Chart Presentation
The script’s output includes:
- Colored backgrounds to indicate bullish or bearish market conditions.
- Plots of trailing stops to visually manage risk.
- Entry points are marked with shapes on the chart, providing clear visual cues for trading decisions.
#### Conclusion
This strategy offers traders a robust framework for trend following with enhanced risk management through dynamic adjustments based on real-time market analysis. It's designed to be versatile and adaptable to a wide range of markets and trading styles, providing traders with a tool that not only follows trends but also adapts to market changes to secure profits and reduce losses.
Fibonacci Trend Reversal StrategyIntroduction
This publication introduces the " Fibonacci Retracement Trend Reversal Strategy, " tailored for traders aiming to leverage shifts in market momentum through advanced trend analysis and risk management techniques. This strategy is designed to pinpoint potential reversal points, optimizing trading opportunities.
Overview
The strategy leverages Fibonacci retracement levels derived from @IMBA_TRADER's lance Algo to identify potential trend reversals. It's further enhanced by a method called " Trend Strength Over Time " (TSOT) (by @federalTacos5392b), which utilizes percentile rankings of price action to measure trend strength. This also has implemented Dynamic SL finder by utilizing @veryfid's ATR Stoploss Finder which works pretty well
Indicators:
Fibonacci Retracement Levels : Identifies critical reversal zones at 23.6%, 50%, and 78.6% levels.
TSOT (Trend Strength Over Time) : Employs percentile rankings across various timeframes to gauge the strength and direction of trends, aiding in the confirmation of Fibonacci-based signals.
ATR (Average True Range) : Implements dynamic stop-loss settings for both long and short positions, enhancing trade security.
Strategy Settings :
- Sensitivity: Set default at 18, adjustable for more frequent or sparse signals based on market volatility.
- ATR Stop Loss Finder: Multiplier set at 3.5, applying the ATR value to determine stop losses dynamically.
- ATR Length: Default set to 14 with RMA smoothing.
- TSOT Settings: Hard-coded to identify percentile ranks, with no user-adjustable inputs due to its intrinsic calculation method.
Trade Direction Options : Configurable to support long, short, or both directions, adaptable to the trader's market assessment.
Entry Conditions :
- Long Entry: Triggered when the price surpasses the mid Fibonacci level (50%) with a bullish TSOT signal.
- Short Entry: Activated when the price falls below the mid Fibonacci level with a bearish TSOT indication.
Exit Conditions :
- Employs ATR-based dynamic stop losses, calibrated according to current market volatility, ensuring effective risk management.
Strategy Execution :
- Risk Management: Features adjustable risk-reward settings and enables partial take profits by default to systematically secure gains.
- Position Reversal: Includes an option to reverse positions based on new TSOT signals, improving the strategy's responsiveness to evolving market conditions.
The strategy is optimized for the BYBIT:WIFUSDT.P market on a scalping (5-minute) timeframe, using the default settings outlined above.
I spent a lot of time creating the dynamic exit strategies for partially taking profits and reversing positions so please make use of those and feel free to adjust the settings, tool tips are also provided.
For Developers: this is published as open-sourced code so that developers can learn something especially on dynamic exits and partial take profits!
Good Luck!
Disclaimer
This strategy is shared for educational purposes and must be thoroughly tested under diverse market conditions. Past performance does not guarantee future results. Traders are advised to integrate this strategy with other analytical tools and tailor it to specific market scenarios. I was only sharing what I've crafted while strategizing over a Solana Meme Coin.

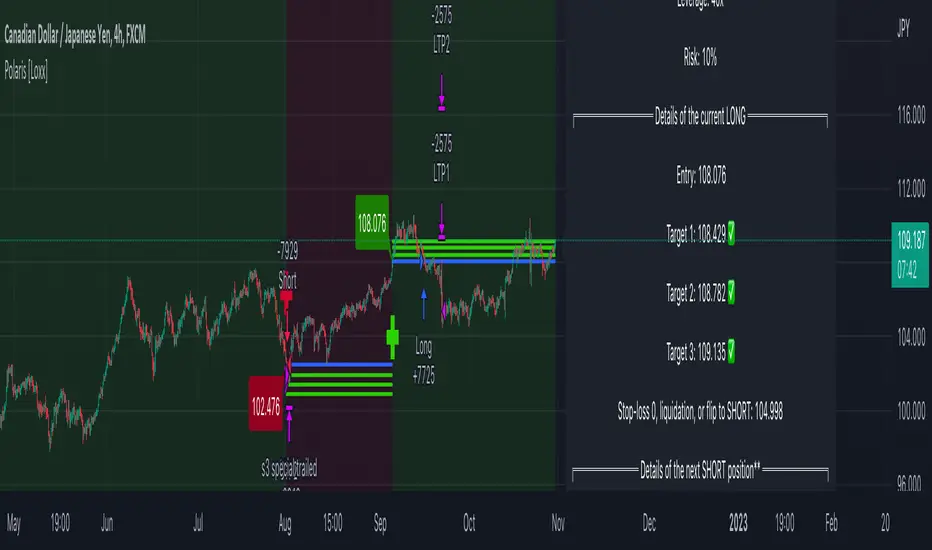
Crypto Punk [Bot] (Zeiierman)█ Overview
The Crypto Punk (Zeiierman) is a trading strategy designed for the dynamic and volatile cryptocurrency market. It utilizes algorithms that incorporate price action analysis and principles inspired by Geometric Brownian Motion (GBM). The bot's core functionality revolves around analyzing differences in high and low prices over various timeframes, estimating drift (trend) and volatility, and applying this information to generate trading signals.
█ How to use the Crypto Punk Bot
Utilize the Crypto Punk Bot as a technical analysis tool to enhance your trading strategy. The signals generated by the bot can serve as a confirmation of your existing approach to entering and exiting the market. Additionally, the backtest report provided by the bot is a valuable resource for identifying the optimal settings for the specific market and timeframe you are trading in.
One method is to use the bot's signals to confirm entry points around key support and resistance levels.
█ Key Features
Let's explain how the core features work in the strategy.
⚪ Strategy Filter
The strategy filter plays a vital role in the entries and exits. By setting this filter, the bot can identify higher or lower price points at which to execute trades. Opting for higher values will make the bot target more long-term extreme points, resulting in fewer but potentially more significant signals. Conversely, lower values focus on short-term extreme points, offering more frequent signals focusing on immediate market movements.
How is it calculated?
This filter identifies significant price points within a specified dynamic range by applying linear regression to the absolute deviation of the range, smoothing out fluctuations, and determining the trend direction. The algorithm then normalizes the data and searches for extreme points.
⚪ External AI filter
The external AI filter allows traders to incorporate two external sources as signal filters. This feature is particularly useful for refining their signal accuracy with additional data inputs.
External sources can include any indicator applied to your TradingView chart that produces a plot as an output, such as a moving average, RSI, supertrend, MACD, etc. Traders can use these indicators of their choice to set filters for screening signals within the strategy.
This approach offers traders increased flexibility to select filters that align with their trading style. For instance, one trader might prefer to take trades when the price is above a moving average, while another might opt for trades when the MACD is below the MACD signal line. These external filters enable traders to choose options that best fit their trading strategies. See the example below. Note that the input sources for the External AI filter can be any indicator applied to the chart, and the input source per se does not make this strategy unique. The AI filter takes the selected input source and applies our function to it. So, if a trader selects RSI as an input filter, RSI is not unique, but how the source is computed within the AI functions is.
How is it calculated?
Once the external filters are selected and enabled within the settings panel, our AI function is applied to enhance the filter's ability to execute trades, even when the set conditions of the filter are not met. For instance, if a trader wants to take trades only when the price is above a moving average, the AI filter can actually execute trades even if the price is below the moving average.
The filter works by combining k-nearest Neighbors (KNN) with Geometric Brownian Motion (GBM) involves first using GBM to model the historical price trends of an asset, identifying patterns of drift and volatility. KNN is then applied to compare the current market conditions with historical instances, identifying the closest matches based on similar market behaviors. By examining the drift values of these nearest historical neighbors, KNN predicts the current trend's direction.
The AI adaptability value is a setting that determines how flexible the AI algorithm is when applying the external AI filter. Setting the adaptability to 10 indicates minimal adaptability, suggesting that the bot will strictly adhere to the set filter criteria. On the other hand, a higher adaptability value grants the algorithm more leeway to "think outside the box," allowing it to consider signals that may not strictly meet the filter criteria but are deemed viable trading opportunities by the AI.
█ Examples
In this example, the RSI is used to filter out signals when the RSI is below the smoothing line, indicating that prices are declining.
Note that the external filter is specifically designed to work with either 'LONG ONLY' or 'SHORT ONLY' modes; it does not apply when the bot is set to trade on 'BOTH' modes. For 'LONG ONLY' positions, the filter criteria are met when source 1 is greater than source 2 (source 1 >= source 2). Conversely, for 'SHORT ONLY' positions, the filter criteria require source 1 to be less than source 2 (source 1 <= source 2).
Examples of Filter Usage:
Long Signals: To receive long signals when the closing price is higher than a moving average, set Source 1 to the 'close' price and Source 2 to a moving average value. This setup ensures that signals are generated only when the closing price exceeds the moving average, indicating a potential upward trend.
█ Settings
⚪ Set Timeframe
Choosing the correct entry and exit timeframes is crucial for the bot's performance. The general guideline is to select a timeframe that is higher than the one currently displayed on the trading chart but still relatively close in duration. For instance, if trading on a 1-minute chart, setting the bot's Timeframe to 5 minutes is advisable.
⚪ Entry
Traders have the flexibility to configure the bot according to their trading strategy, allowing them to choose whether the bot should engage in long positions only, short positions only or both. This customization ensures that the bot aligns with the trader's market outlook and risk tolerance.
⚪ Pyramiding
Pyramiding functionality is available to enhance the bot's trading strategy. If the current position experiences a drawdown by a specified number of points, the bot is programmed to add new positions to the existing one, potentially capitalizing on lower prices to average down the entry cost. To utilize this feature, access the settings panel, navigate to 'Properties,' and look for 'Pyramiding' to specify the number of times the bot can re-enter the market (e.g., setting it to 2 allows for two additional entries).
⚪ Risk Management
The bot incorporates several risk management methods, including a regular stop loss, trailing stop, and risk-reward-based stop loss and exit strategies. These features assist traders in managing their risk.
Stop Loss
Trailing Stop
⚪ Trading on specific days
This feature allows trading on specific days by setting which days of the week the bot can execute trades on. It enables traders to tailor their strategies according to market behavior on particular days.
⚪ Alerts
Alerts can be set for entry, exit, and risk management. This feature allows traders to automate their trading strategy, ensuring timely actions are taken according to predefined criteria.
█ How is Crypto Punk calculated?
The Crypto Punk Bot is a trading bot that utilizes a combination of price action analysis and elements inspired by Geometric Brownian Motion (GBM) to generate buy and sell signals for cryptocurrencies. The bot focuses on analyzing the difference between high and low prices over various timeframes, alongside estimates of drift (trend) and volatility derived from GBM principles.
Timeframe Analysis for Price Action
The bot examines multiple timeframes (e.g., daily, weekly) to identify the range between the highest and lowest prices within each period. This range analysis helps in understanding market volatility and the potential for significant price movements. The algorithm calculates the trading range by applying maximum and minimum functions to the set of prices over your selected timeframe. It then subtracts these values to determine the range's width. This method offers a quantitative measure of the asset's price volatility for the specified period.
Estimating Drift (Trend)
The bot estimates the drift component, which reflects the underlying trend or expected return of the cryptocurrency. The algorithm does this by estimating the drift (trend) using Geometric Brownian Motion (GBM), which involves determining an asset's average rate of return over time, reflecting the asset's expected direction of movement.
Estimating Volatility
Volatility is estimated by calculating the standard deviation of the logarithmic returns of the cryptocurrency's price over the same timeframe used for the drift calculation. Geometric Brownian Motion (GBM) involves measuring the extent of variation or dispersion in the returns of an asset over time. In the context of GBM, volatility quantifies the degree to which the price of an asset is expected to fluctuate around its drift.
Combining Drift and Volatility for Signal Generation
The bot uses the calculated drift and volatility to understand the current market conditions. A higher drift coupled with manageable volatility may indicate a strong upward trend, suggesting a potential buy signal. Conversely, a low or negative drift with increasing volatility might suggest a weakening market, triggering a sell signal.
█ Strategy Properties
This script backtest is done on the 1 hour chart Bitcoin, using the following backtesting properties:
Balance (default): 10 000 (default base currency)
Order Size: 10% of the equity
Commission: 0.05 %
Slippage: 500 ticks
Stop Loss: Risk Reward set to 1
These parameters are set to provide an accurate representation of the backtesting environment. It's important to recognize that default settings may vary for several reasons outlined below:
Order Size: The standard is set at one contract to facilitate compatibility with a wide range of instruments, including futures.
Commission: This fee is subject to fluctuation based on the specific market and financial instrument, and as such, there isn't a standard rate that will consistently yield accurate outcomes.
We advise users to customize the Script Properties in the strategy settings to match their personal trading accounts and preferred platforms. This adjustment is crucial for obtaining practical insights from the deployed strategies.
-----------------
Disclaimer
The information contained in my Scripts/Indicators/Ideas/Algos/Systems does not constitute financial advice or a solicitation to buy or sell any securities of any type. I will not accept liability for any loss or damage, including without limitation any loss of profit, which may arise directly or indirectly from the use of or reliance on such information.
All investments involve risk, and the past performance of a security, industry, sector, market, financial product, trading strategy, backtest, or individual's trading does not guarantee future results or returns. Investors are fully responsible for any investment decisions they make. Such decisions should be based solely on an evaluation of their financial circumstances, investment objectives, risk tolerance, and liquidity needs.
My Scripts/Indicators/Ideas/Algos/Systems are only for educational purposes!

Long EMA Strategy with Advanced Exit OptionsThis strategy is designed for traders seeking a trend-following system with a focus on precision and adaptability.
**Core Strategy Concept**
The essence of this strategy lies in use of Exponential Moving Averages (EMAs) to identify potential long (buy) positions based on the relative positions of short-term, medium-term, and long-term EMAs. The use of EMAs is a classic yet powerful approach to trend detection, as these indicators smooth out price data over time, emphasizing the direction of recent price movements and potentially signaling the beginning of new trends.
**Customizable Parameters**
- **EMA Periods**: Users can define the periods for three EMAs - long-term, medium-term, and short-term - allowing for a tailored approach to capture trends based on individual trading styles and market conditions.
- **Volatility Filter**: An optional Average True Range (ATR)-based volatility filter can be toggled on or off. When activated, it ensures that trades are only entered when market volatility exceeds a user-defined threshold, aiming to filter out entries during low-volatility periods which are often characterized by indecisive market movements.
- **Trailing Stop Loss**: A trailing stop loss mechanism, expressed as a percentage of the highest price achieved since entry, provides a dynamic way to manage risk by allowing profits to run while cutting losses.
- **EMA Exit Condition**: This advanced exit option enables closing positions when the short-term EMA crosses below the medium-term EMA, serving as a signal that the immediate trend may be reversing.
- **Close Below EMA Exit**: An additional exit condition, which is disabled by default, allows positions to be closed if the price closes below a user-selected EMA. This provides an extra layer of flexibility and risk management, catering to traders who prefer to exit positions based on specific EMA thresholds.
**Operational Mechanics**
Upon activation, the strategy evaluates the current price in relation to the set EMAs. A long position is considered when the current price is above the long-term EMA, and the short-term EMA is above the medium-term EMA. This setup aims to identify moments where the price momentum is strong and likely to continue.
The strategy's versatility is further enhanced by its optional settings:
- The **Volatility Filter** adjusts the sensitivity of the strategy to market movements, potentially improving the quality of the entries during volatile market conditions.
The Average True Range (ATR) is a key component of this filter, providing a measure of market volatility by calculating the average range between the high and low prices over a specified number of periods. Here's how you can adjust the volatility filter settings for various market conditions, focusing on filtering out low-volatility markets:
Setting Examples for Volatility Filter
1. High Volatility Markets (e.g., Cryptocurrencies, Certain Forex Pairs):
ATR Periods: 14 (default)
ATR Multiplier: Setting the multiplier to a lower value, such as 1.0 or 1.2, can be beneficial in high-volatility markets. This sensitivity allows the strategy to react to volatility changes more quickly, ensuring that you're entering trades during periods of significant movement.
2. Medium Volatility Markets (e.g., Major Equity Indices, Medium-Volatility Forex Pairs):
ATR Periods: 14 (default)
ATR Multiplier: A multiplier of 1.5 (default) is often suitable for medium volatility markets. It provides a balanced approach, ensuring that the strategy filters out low-volatility conditions without being overly restrictive.
3. Low Volatility Markets (e.g., Some Commodities, Low-Volatility Forex Pairs):
ATR Periods: Increasing the ATR period to 20 or 25 can smooth out the volatility measure, making it less sensitive to short-term fluctuations. This adjustment helps in focusing on more significant trends in inherently stable markets.
ATR Multiplier: Raising the multiplier to 2.0 or even 2.5 increases the threshold for volatility, effectively filtering out low-volatility conditions. This setting ensures that the strategy only triggers trades during periods of relatively higher volatility, which are more likely to result in significant price movements.
How to Use the Volatility Filter for Low-Volatility Markets
For traders specifically interested in filtering out low-volatility markets, the key is to adjust the ATR Multiplier to a higher level. This adjustment increases the threshold required for the market to be considered sufficiently volatile for trade entries. Here's a step-by-step guide:
Adjust the ATR Multiplier: Increase the ATR Multiplier to create a higher volatility threshold. A multiplier of 2.0 to 2.5 is a good starting point for very low-volatility markets.
Fine-Tune the ATR Periods: Consider lengthening the ATR calculation period if you find that the strategy is still entering trades in undesirable low-volatility conditions. A longer period provides a more averaged-out measure of volatility, which might better suit your needs.
Monitor and Adjust: Volatility is not static, and market conditions can change. Regularly review the performance of your strategy in the context of current market volatility and adjust the settings as necessary.
Backtest in Different Conditions: Before applying the strategy live, backtest it across different market conditions with your adjusted settings. This process helps ensure that your approach to filtering low-volatility conditions aligns with your trading objectives and risk tolerance.
By fine-tuning the volatility filter settings according to the specific characteristics of the market you're trading in, you can enhance the performance of this strategy
- The **Trailing Stop Loss** and **EMA Exit Conditions** provide two layers of exit strategies, focusing on capital preservation and profit maximization.
**Visualizations**
For clarity and ease of use, the strategy plots the three EMAs and, if enabled, the ATR threshold on the chart. These visual cues not only aid in decision-making but also help in understanding the market's current trend and volatility state.
**How to Use**
Traders can customize the EMA periods to fit their trading horizon, be it short, medium, or long-term trading. The volatility filter and exit options allow for further customization, making the strategy adaptable to different market conditions and personal risk tolerance levels.
By offering a blend of trend-following principles with advanced risk management features, this strategy aims to cater to a wide range of trading styles, from cautious to aggressive. Its strength lies in its flexibility, allowing traders to fine-tune settings to their specific needs, making it a potentially valuable tool in the arsenal of any trader looking for a disciplined approach to navigating the markets.

Octopus Nest Strategy Hello Fellas,
Hereby, I come up with a popular strategy from YouTube called Octopus Nest Strategy. It is a no repaint, lower timeframe scalping strategy utilizing PSAR, EMA and TTM Squeeze.
The strategy considers these market factors:
PSAR -> Trend
EMA -> Trend
TTM Squeeze -> Momentum and Volatility by incorporating Bollinger Bands and Keltner Channels
Note: As you can see there is a potential improvement by incorporating volume.
What's Different Compared To The Original Strategy?
I added an option which allows users to use the Adaptive PSAR of @loxx, which will hopefully improve results sometimes.
Signals
Enter Long -> source above EMA 100, source crosses above PSAR and TTM Squeeze crosses above 0
Enter Short -> source below EMA 100, source crosses below PSAR and TTM Squeeze crosses below 0
Exit Long and Exit Short are triggered from the risk management. Thus, it will just exit on SL or TP.
Risk Management
"High Low Stop Loss" and "Automatic High Low Take Profit" are used here.
High Low Stop Loss: Utilizes the last high for short and the last low for long to calculate the stop loss level. The last high or low gets multiplied by the user-defined multiplicator and if no recent high or low was found it uses the backup multiplier.
Automatic High Low Take Profit: Utilizes the current stop loss level of "High Low Stop Loss" and gets calculated by the user-defined risk ratio.
Now, follows the bunch of knowledge for the more inexperienced readers.
PSAR: Parabolic Stop And Reverse; Developed by J. Welles Wilders and a classic trend reversal indicator.
The indicator works most effectively in trending markets where large price moves allow traders to capture significant gains. When a security’s price is range-bound, the indicator will constantly be reversing, resulting in multiple low-profit or losing trades.
TTM Squeeze: TTM Squeeze is a volatility and momentum indicator introduced by John Carter of Trade the Markets (now Simpler Trading), which capitalizes on the tendency for price to break out strongly after consolidating in a tight trading range.
The volatility component of the TTM Squeeze indicator measures price compression using Bollinger Bands and Keltner Channels. If the Bollinger Bands are completely enclosed within the Keltner Channels, that indicates a period of very low volatility. This state is known as the squeeze. When the Bollinger Bands expand and move back outside of the Keltner Channel, the squeeze is said to have “fired”: volatility increases and prices are likely to break out of that tight trading range in one direction or the other. The on/off state of the squeeze is shown with small dots on the zero line of the indicator: red dots indicate the squeeze is on, and green dots indicate the squeeze is off.
EMA: Exponential Moving Average; Like a simple moving average, but with exponential weighting of the input data.
Don't forget to check out the settings and keep it up.
Best regards,
simwai
---
Credits to:
@loxx
@Bjorgum
@Greeny

MMI Auto Backtesting StrategyDescription:
A strategy based on ATR with auto-backtesting capabilities, Take Profit and Stop Loss (either Normal or Trailing). It allows you to select ranges of values and step for each parameter, and backtest the strategy on a multitude of input combinations at once. You can alternatively use a constant value for each parameter. The backtesting results strive to be as close as possible to those given by Tradingview Strategy Tester.
The strategy displays a table with results for different input combinations. This has columns showing current input combination as well as the following stats: Net Profit, Number of trades, % of Profitable trades, Profit Factor, Max Drawdown, Max Runup, Average Trade and Average number of bars in a trade.
You can sort the table by any column (including sorting by multiple columns at the same time) to find, for example, input combination that gives highest Net Profit (or, if sorting by multiple columns, to find input combination with the best balance of Net Profit and % of Profitable trades). You can filter by any column as well (or multiple columns at the same time), using logical expressions like "< value", "> value", "<= value", ">= value". And you can use logical expressions like "< value%" for Net Profit, Max Drawdown, Max Runup and Average trade to filter by percentage value. You will see a "↓" symbol in column's header if that column is sorted from Highest to Lowest, a "↑" symbol if it's sorted from Lowest to Highest and a "𐕢" symbol if that column is being filtered.
The table has customisable styles (like text color, background color of cells, etc.), and can show the total number of backtested combinations with the time taken to test them. You can also change Initial Capital and Position Size (either Contracts, Currency or % of Equity).
Parameters:
The following parameters are located in the "INPUTS (USUAL STRATEGY)" group, and control the behaviour of strategy itself (not the auto-backtesting functionality):
- Period: ATR Length
- Multiplier: ATR Multiplier
- DPO: length of the filtering moving average
- SL: stop loss
- TP: take profit
- Use Stop Loss: enable stop loss
- Stop Loss Mode: stop loss mode (either Normal or Trailing)
- Use Take Profit: enable take profit
- Wicks: use high & low price, or close price
The strategy also has various parameters separated by different groups:
- INPUTS (AUTO-BACKTESTING): has the same parameters as the "INPUTS (USUAL STRATEGY)" group, but controls the input combinations for auto-backtesting; all the numeric parameters have 3 values: F/V (from), T (to) and S (step); if the checkbox to the left of F/V parameter is off, the value of F/V will indicate the constant value used for that parameter (if the checkbox is on, the values will be from F/V to T using step S)
- STRATEGY: contains strategy related parameters like Initial Capital and Position Size
- BACKTESTING: allows you to display either Percentage, Absolute or Both values in the table and has checkboxes that allow you to exclude certain columns from the table
- SORTING: allows you to select sorting mode (Highest to Lowest or vice versa) and has checkboxes in case you want to sort by multiple columns at the same time
- FILTERING: has a text field for each column of the strategy where you can type logical expressions to filter the values
- TABLE: contains styling parameters
Many parameters have the "(i)" description marker, so hover over it to see more details.
Problems:
- The script works best on lower timeframes and continuous markets (trades 24/7), in other cases the backtesting results may vary from those that Tradingview shows
- The script shows closest results when Take Profit and Stop Loss are not used
- Max Runup percentage value is often wrong
Limitations:
- As we are limited by the maximum time a script can be running (which is 20s for Free plan and 40s for Paid plans), we can only backtest several hundreds of combinations within that timeframe (though it depends on the parameters, market and timeframe of the chart you use)

Trend Confirmation StrategyThe profitability and uniqueness of a trading strategy depend on various factors including market conditions, risk management, and the strategy's ability to capitalize on price movements. I'll describe the strategy provided and highlight its potential benefits and differences compared to other strategies:
Strategy Overview:
The provided strategy combines three technical indicators: Supertrend, MACD, and VWAP. It aims to identify potential entry and exit points by confirming trend direction and considering the proximity to the VWAP level. The strategy also incorporates stop-loss and take-profit mechanisms, as well as a trailing stop.
Unique Aspects and Potential Benefits:
Trend Confirmation: The strategy uses both Supertrend and MACD to confirm the trend direction. This dual confirmation can increase the likelihood of accurate trend identification and filter out false signals.
VWAP Confirmation: The strategy considers the proximity of the price to the VWAP level. This dynamic level can act as a support or resistance and provide additional context for entry decisions.
Adaptive Stop Loss: The strategy sets a stop-loss range, which helps provide some tolerance for minor price fluctuations. This adaptive approach considers market volatility and helps prevent premature stop-loss triggers.
Trailing Stop: The strategy incorporates a trailing stop mechanism to lock in profits as the trade moves in the desired direction. This can potentially enhance profitability during strong trends.
Partial Profit Booking: While not explicitly implemented in the provided code, you could consider booking partial profits when the MACD shows a crossover in the opposite direction. This aspect could help secure gains while still keeping exposure to potential further price movements.
Key Differences from Other Strategies:
Dual Indicator Confirmation: The combination of Supertrend and MACD for trend confirmation is a unique aspect of this strategy. It adds an extra layer of filtering to enhance the accuracy of entry signals.
Dynamic VWAP: Incorporating the VWAP level into the decision-making process adds a dynamic element to the strategy. VWAP is often used by institutional traders, and its inclusion can provide insights into the market sentiment.
Adaptive Stop Loss and Trailing: The strategy's use of an adaptive stop-loss range and a trailing stop can help manage risk and protect profits more effectively during changing market conditions.
Partial Profit Booking: The suggestion to consider partial profit booking upon MACD crossovers in the opposite direction is a practical approach to secure gains while staying in the trade.
Caution and Considerations:
Backtesting: Before deploying any strategy in real trading, it's crucial to thoroughly backtest it on historical data to understand its performance under various market conditions.
Risk Management: While the strategy has built-in risk management mechanisms, it's essential to carefully manage position sizes and overall portfolio risk.
Market Conditions: No strategy works well in all market conditions. It's important to be flexible and adjust the strategy or refrain from trading during particularly volatile or unpredictable periods.
Continuous Monitoring: Even though the strategy includes automated components, continuous monitoring of the trades and market conditions is necessary.
Adaptability: Markets can change over time. Traders need to be prepared to adapt the strategy as necessary to stay aligned with evolving market dynamics.

Risk to Reward - FIXED SL BacktesterDon't know how to code? No problem! TradingView is an excellent platform for you. ✅ ✅
If you have an indicator that you want to backtest using a risk-to-reward ratio or fixed take profit/stop loss levels, then the Risk to Reward - FIXED SL Backtester script is the perfect solution for you.
introducing Risk to Reward - FIXED SL Backtester Script which will allow you to test any indicator / Signal with RR or Fixed SL system
How does it work ?!
Once you connect the script to your indicator, it will analyze your entry points and perform calculations based on them. It will then open trades for you according to the specified inputs in the script settings.
HOW TO CONNECT IT to your indicator?
simply open your indicator code and add the below line of code to it
plot(Signal ? 100 : 0,"Signal",display = display.data_window)
Replace Signal with the long condition from your own indicator. You can also modify the value 100 to any number you prefer. After that, open the settings.
Once the script is connected to your indicator, you can choose from two options:
Risk To Reward Ratio System
Fixed TP/ SL System
🔸if you select the Risk to Reward System ⤵️
The Risk-to-Reward System requires the calculation of a stop loss. That's why I have included three different types of stop-loss calculations for you to choose from:
ATR Based SL
Pivot Low SL
VWAP Based SL
Your stop loss and take profit levels will be automatically calculated based on the selected stop loss method and your risk-to-reward ratio.
You can also adjust their values to match your desired risk level. The trades will be displayed on the chart.
with the ability to change their values to match your risk.
once this is done, trades will be displayed on the chart
🔸if you select the Fixed system ⤵️
You have 2 inputs, which are FIXED TP & Fixed SL
input the values you want, and trades will be on your chart...
I have also added a Breakeven feature for you.
with this Breakeven feature the trade will not just move SL to Entry ?! NO NO, it will place it above entry by a % you input yourself, so you always win! 🚀
Here is an example
Enjoy, and have fun, if you have any questions do not hesitate to ask

Wyckoff Range StrategyThe Wyckoff Range Strategy is a trading strategy that aims to identify potential accumulation and distribution phases in the market using the principles of Wyckoff analysis. It also incorporates the detection of spring and upthrust patterns.
Here's a step-by-step explanation of how to use this strategy:
Understanding Accumulation and Distribution Phases:
Accumulation Phase: This is a period where smart money (large institutional traders) accumulates a particular asset at lower prices. It is characterized by a sideways or consolidating price action.
Distribution Phase: This is a period where smart money distributes or sells a particular asset at higher prices. It is also characterized by a sideways or consolidating price action.
Input Variables:
crossOverLength: This variable determines the length of the moving average crossover used to identify accumulation and distribution phases. You can adjust this value based on the market you are trading and the time frame you are analyzing.
stopPercentage: This variable determines the percentage used to calculate the stop loss level. It helps you define a predefined level at which you would exit a trade if the price moves against your position.
Strategy Conditions:
Enter Long: The strategy looks for a crossover of the close price above the SMA of the close price with a length of crossOverLength and a crossover of the low price above the SMA of the low price with a length of 20. This combination suggests the start of an accumulation phase and a potential buying opportunity.
Exit Long: The strategy looks for a crossunder of the close price below the SMA of the close price with a length of crossOverLength or a crossunder of the high price below the SMA of the high price with a length of 20. This combination suggests the end of an accumulation phase and a potential exit signal for long positions.
Enter Short: The strategy looks for a crossunder of the close price below the SMA of the close price with a length of crossOverLength and a crossunder of the high price below the SMA of the high price with a length of 20. This combination suggests the start of a distribution phase and a potential selling opportunity.
Exit Short: The strategy looks for a crossover of the close price above the SMA of the close price with a length of crossOverLength or a crossover of the low price above the SMA of the low price with a length of 20. This combination suggests the end of a distribution phase and a potential exit signal for short positions.
Stop Loss:
The strategy sets a stop loss level for both long and short positions. The stop loss level is calculated based on the stopPercentage variable, which represents the percentage of the current close price. If the price reaches the stop loss level, the strategy will automatically exit the position.
Plotting Wyckoff Schematics:
The strategy plots different shapes on the chart to indicate the identified phases and patterns. Green and red labels indicate the accumulation and distribution phases, respectively. Blue triangles indicate spring patterns, and orange triangles indicate upthrust patterns.
To use this strategy, you can follow these steps:
Jim Forte — Anatomy of a Trading Range
robertbrain.com/Bull...+a+Trading+Range.pdf

Wunder Breakout botWunder Breakout bot
1. Wunder Breakout bot is based on the breakout of the trend line. Breakout is a technical trading strategy that is used to determine the moment of a trend line breakout on the price chart. It is based on the assumption that when price crosses a trend line, it signals a change in trend direction and the possible start of a new price movement.
2. The entry points for the trendline breakout strategy are based on the principle of breaking through a set trendline. This means that we look for the moment when the price of the asset crosses the trend line that we have established in order to enter a sell or buy position.
3. We use fixed take-profit and stop-loss, but you can use other risk management systems, based on the suggested settings.
4. Wunder Breakout bot script has added a function to calculate the risk per portfolio (your deposit). When this option is enabled, you get the calculation of the entry amount in dollars relative to your Stop Loss. You can chooseselect the percentage of risk per your portfolio in the settings. the percentage of risk per your portfolio in the settings. The loss will be calculated from the amount that will be displayed on the chart.
For example, if your deposit is $1000 and you set your risk at 1%, with a Stop Loss of 5%, your entry volume would be $200. The SL loss would be $10. $10 is your 1% risk or 1% of your deposit.
*Important! ** The risk per trade must be less than the Stop Loss value. If the risk is more than SL, you should use leverage.
The amount of funds included in the deal is calculated in dollars. This option was created if you want to send a dollar amount from Tradingview to the exchange. However, by specifying the volume in dollars, you will get the net profit and drawdown displayed incorrectly in the backtest results because TradingView calculates the backtest volume in contracts.
To display the correct net profit and drawdown values in Tradingview backtest results, use the "Volume in Contracts" option.

SPY 4 Hour Swing TraderThe purpose of this script is to spot 4 hour pivots that indicate ~30 trading day swings. As VIX starts to drop options trading will get more boring and as we get back on the bull and can benefit from swing trading strategy. Swing trading doesn't make a whole lot of sense when VIX is above 28. Seems to get best results on 4 hour chart for this one. This indicator spots a go long opportunity when the 5 ema crosses the 13 ema on the 4 hour along with the RSI > 50 and the ADX > 20 and Stoichastic values (smoothed line < 80 or line < 90) and close > last candle close and the True Range < 6. It also spots uses a couple different means to determine when to exit the trade. Sell condition is primarily when the 13 ema crosses the 5 ema and the MACD line crosses below the signal line and the smoothed Stoichastic appears oversold (greater than 60) and slop of RSI < -.2. Stop Losses and Take Profits are configurable in Inputs along with ability to include short trades plus other MACD and Stoichastic settings. If a stop loss is encountered the trade will close. Also once twice the expected move is encountered partial profits will taken and stop losses and take profits will be re-established based on most recent close. Also a VIX above 28 will trigger any open positions to close. If trying to use this for something other than SPXL it is best to update stop losses and take profit percentages and check backtest results to ensure proper levels have been selected and the script gives satisfactory results.

SPY 1 Hour Swing TraderThe purpose of this script is to spot 1 hour pivots that indicate ~5 to 6 trading day swings. Results indicate that swings are held approximately 5 to 6 trading days on average, over the last 6 years. This indicator spots a go long opportunity when the 5 ema crosses the 13 ema on the 1 hour along with the RSI > 50. It also spots uses a couple different means to determine when to exit the trade. Sell condition is primarily when the 13 ema crosses the 5 ema and the MACD line crosses below the signal line and the smoothed Stoichastic appears oversold (greater than 60). Stop Losses and Take Profits are configurable in Inputs along with ability to include short trades plus other MACD and Stoichastic settings. If a stop loss is encountered the trade will close. Also once twice the expected move is encountered partial profits will taken and stop losses and take profits will be re-established based on most recent close. Once long trades are exited, short trades will be initiated if recent conditions appeared oversold and input option for short trading is enabled. If trying to use this for something other than SPXL it is best to update stop losses and take profit percentages and check backtest results to ensure proper levels have been selected and the script gives satisfactory results.

TENKAN SCALPER STRATEGYTENKAN SCALP is a fully automatic trading system.
It is a continuation of our previous ichimoku release. This time however we throw out the rule book and use ICHIMOKU in a very different way.
It applies non traditional money management tactics.
While most trading strategies rely on a stop loss and a take profit target to manage risk. This strategy uses either no stop loss at all or a time based stop loss.
You might ask yourself the question why would you keep a trade open if it goes against you? Here are a phew reasons why the script does what it does.
Forex Markets consolidate most of the time. If you wait long enough your Take Profit will get hit anyways most of the time
You don't have to risk everything per trade. I keep my orders small so to keep some powder to get into some more trades
All the extra trades you take while one trade is in drawdown limit the drawdown as they provide cashflow
On lower timeframes the markets are so chaotic that a stop loss is very likely to get hit by a wick
About backtest below
This backtest uses a spread of 2 pips for entries and a default position size of 100% of equity. This is only possible on exchanges where spread is low and you have 10:1 leverage or more. It does not represent results obtainable without leverage. Do take into account that there are a lot of forex exchanges that provide this leverage, however a 2 pip spread is not always guaranteed and only applies to major pairs.
This backtest does not use the TIME BASED STOPS functionality.
Always start with small position sizing and see how the strategy performs before adding risk.
Explanation of variables:
Chikou(lagging span): pink line, this is price plotted 26 bars ago. People ignore the power of this it is crucial to see how chikou behaves towards past price action as seen in the chart below where we got an entry at red arrow because chikou bounced from past fractal bottom.
Kijun-Sen(base line): Black line or color coded line. This is the equilibrium of last 26 candles. To me this is the most important line in the system as it attracts price.
Kijun = (Highest high of 26 periods + Lowest low of 26 periods) ÷ 2
Tenkan-Sen(conversion line): Blue line. This is the equilibrium of last 9 candles. In a strong uptrend price stays above this line.
Tenkan = (Highest high of 9 periods + Lowest low of 9 periods) ÷ 2
Senkou A (Leading span A)= Pink cloud line, this is the average of the 2 components projected 26 bars in the future.
Senkou A = (Tenkan + Kijun) ÷ 2
Senkou B (Leading span B) = Green cloud line, this is the 52 day equilibrium projected 26 bars in the future.
Senkou B = (Highest high of prior 52 periods + Lowest low of prior 52 periods) ÷ 2
projection: Script uses same function for variable calculation and substracts a number on each next bar as to make a projection of where the variable will be in future bars if price stayed the same. This works as ICHIMOKU calculations use the middle point of a past set of data. The shorter that amount of bars will be in line with the data that it will be restricted to in future if price stayed the same.
Detection of Market Environment
To enter trades the script uses a lot of ICHIMOKU concepts. Contrary to how most people trade ICHIMOKU this script takes an environment that ICHIMOKU identifies as trending upwards and shorts in that environment. The same will be applied to a downtrend where it will open LONGS.
List of CRITERIA for a trend:
Grapling Hook: this is a component based on the chikou span (closing price displaced 26 bars into the past). The script will use an ATR based range to define a possible future projection to the CHIKOU line. For a market to be bullish there should be no price action happening within this area. Market is free to move upwards. Vice versa for bearish .
Kumo Cloud: script will check if price is above the cloud for bullish trend and below cloud for bearish trend .
Chikou above Kijun: script will check if the chikou line is above the KIJUN line of 26 bars ago. This is further confirmation that price is trending high enough compared to it's past data. Vice versa for downtrend.
Kijun projection: script will check if past Kijun is lower than future projected Kijun. This to ensure we get an equilibrium in our favour in the future. Vice versa for downtrend
Tenkan projection: script will check if future Tenkan-sen will be higher than Kijun-sen for an uptrend. Vice versa for downtrend.
Cloud projection: script will check if in 9 bars the Senkou Span A will be higher than Senkou Span B for an uptrend. Vice versa for downtrend.
Example:
This script does not visualise the prediction lines like I show in the example. I show them here to clarify how the script works.
Usage
Backtests are not indicative of future results, although a trader may want to use a strategy script to have a deeper understanding of how their strategy responds to varying market conditions, or as a tool for identifying possible flaws for a strategy that may be indicative of good or bad performance in the future.
Strategy Settings:
Minimum Body Size (atr): this is the minimum ATR a signal bar needs to be for entry. This is useful because our TP is based on previous bar.
Lot size per trade: this setting does not impact backtest. It is used to for the signals to let tradingconnect.com know your position size.
Direction: do you want to trade longs or shorts. I personally use both a long bot and a short bot at the same time.
Positions Allowed: the amount of positions the script will keep open as a maximum. You do not want to open too many positions, this is for risk management.
Close all positions at drawdown: if total open positions loss gets to this % target it will close all positions.
MetaTrader Prefix: when the script sends a signal it will put this text right before the symbol name from syminfo.ticker
MetaTrader Suffix: when the script sends a signal it will put this text right after the symbol name from syminfo.ticker
Charts below are some examples on how the script handles orders on default settings:
without time based SL
with time based SL
how it handles pyramiding
www.tradingview.com
Tradingconnector.com:
For full automation of the forex market the script uses this connector to execute trade on MT4. The alerts the script sends using the alerts() function call are structured in a way tradingconnector will recognise and send directly to MT4. You can find documentation about this tool on their own website.
Personal recommendation is to start with a minimum lot size and track performance, if you are comfortable scale the size up. You can do that by increasing the lot size setting in the script and making a new alert. Make sure to delete the old one.
How to access
You can see the Author's Instructions below to visit our telegram to get more information on how to get access.

Token Metrics IndicatorThe Token Metrics Combined Indicator v2 is a comprehensive technical analysis tool designed to output Long/Short signals for crypto assets on TradingView. It combines multiple indicators, including Token Metrics Clouds, Token Metrics Trend Lines , Token Metrics Channels, and signals, to give a comprehensive outlook on the market trend and potential entry/exit points.
Users can backtest the signals to understand the strategy's historical performance, learn how to use it, identify its pros and cons, and determine the market conditions it best suits. It is important to note that the backtesting performance does not indicate future results.
The methods for calculating fixed stop-losses vary depending on the trading pattern. A fixed stop-loss is used for long-term trading, while a trading stop-loss is used for high-frequency trading. This provides flexible investment risk management, allowing you to assign different stop-loss percentages to different trading strategies.
The Length input allows users to control the indicator’s sensitivity, with a default value of 20 bars for long-term trading and 9 bars for high-frequency trading. The Adjustment Factor input has a default value of 0.1 and can be adjusted to adapt to changing levels of volatility . The Stop-loss input allows users to control their risk tolerance, with a default value of 8% for long-term trading and 2% for high-frequency trading.
Token Metrics Clouds incorporates a bullish / bearish trend indicator, which uses two adaptive moving averages that adapt to volatility , reducing false trend signals during range-bound environments and providing a more accurate representation of market trends.
The Token Metrics Trendline is a long-term indicator that uses an adaptive moving average to identify long-term trends. This can also be used for long-term resistance and support levels, providing a comprehensive overview of the current market situation for both long-term and high-frequency traders.
The Token Metrics Signals indicator provides long, short, and close signals, indicating when to enter and exit long or short positions based on the TM trend-following strategy.
The Token Metrics Channels indicator is a top/bottom indicator that adjusts to current levels of volatility . This uses adaptive Donchian channels to determine the previous short-term swing high and low, providing insight into where short-term resistance or support might be forming and where breakouts can occur. The look-back periods change according to the strategy time frame, offering a flexible and dynamic approach to market analysis.
Long-term trading is a trend-following strategy best suited for daily and weekly timeframes. This strategy works well in trending markets but may produce false signals in choppy or range-bound markets.
High-frequency trading is a mean-reverting strategy best suited for 15-minute, 30-minute, and 1-hour timeframes. This strategy performs well in choppy or range-bound markets but may not be effective in strong trending markets.

Ultimate Strategy Template (Advanced Edition)Hello traders
This script is an upgraded version of that one below
New features
- Upgraded to Pinescript version 5
- Added the exit SL/TP now in real-time
- Added text fields for the alerts - easier to send the commands to your trading bots
Step 1: Create your connector
Adapt your indicator with only 2 lines of code and then connect it to this strategy template.
For doing so:
1) Find in your indicator where are the conditions printing the long/buy and short/sell signals.
2) Create an additional plot as below
I'm giving an example with a Two moving averages cross.
Please replicate the same methodology for your indicator wether it's a MACD , ZigZag , Pivots , higher-highs, lower-lows or whatever indicator with clear buy and sell conditions.
//@version=5
indicator(title='Moving Average Cross', shorttitle='Moving Average Cross', overlay=true, precision=6, max_labels_count=500, max_lines_count=500)
type_ma1 = input.string(title='MA1 type', defval='SMA', options= )
length_ma1 = input(10, title=' MA1 length')
type_ma2 = input.string(title='MA2 type', defval='SMA', options= )
length_ma2 = input(100, title=' MA2 length')
// MA
f_ma(smoothing, src, length) =>
rma_1 = ta.rma(src, length)
sma_1 = ta.sma(src, length)
ema_1 = ta.ema(src, length)
iff_1 = smoothing == 'EMA' ? ema_1 : src
iff_2 = smoothing == 'SMA' ? sma_1 : iff_1
smoothing == 'RMA' ? rma_1 : iff_2
MA1 = f_ma(type_ma1, close, length_ma1)
MA2 = f_ma(type_ma2, close, length_ma2)
// buy and sell conditions
buy = ta.crossover(MA1, MA2)
sell = ta.crossunder(MA1, MA2)
plot(MA1, color=color.new(color.green, 0), title='Plot MA1', linewidth=3)
plot(MA2, color=color.new(color.red, 0), title='Plot MA2', linewidth=3)
plotshape(buy, title='LONG SIGNAL', style=shape.circle, location=location.belowbar, color=color.new(color.green, 0), size=size.normal)
plotshape(sell, title='SHORT SIGNAL', style=shape.circle, location=location.abovebar, color=color.new(color.red, 0), size=size.normal)
/////////////////////////// SIGNAL FOR STRATEGY /////////////////////////
Signal = buy ? 1 : sell ? -1 : 0
plot(Signal, title='🔌Connector🔌', display = display.data_window)
Basically, I identified my buy, sell conditions in the code and added this at the bottom of my indicator code
Signal = buy ? 1 : sell ? -1 : 0
plot(Signal, title="🔌Connector🔌", transp=100)
Important Notes
🔥 The Strategy Template expects the value to be exactly 1 for the bullish signal, and -1 for the bearish signal
Now you can connect your indicator to the Strategy Template using the method below or that one
Step 2: Connect the connector
1) Add your updated indicator to a TradingView chart
2) Add the Strategy Template as well to the SAME chart
3) Open the Strategy Template settings and in the Data Source field select your 🔌Connector🔌 (which comes from your indicator)
From then, you should start seeing the signals and plenty of other stuff on your chart
🔥 Note that whenever you'll update your indicator values, the strategy statistics and visual on your chart will update in real-time
Settings
- Color Candles: Color the candles based on the trade state ( bullish , bearish , neutral)
- Close positions at market at the end of each session: useful for everything but cryptocurrencies
- Session time ranges: Take the signals from a starting time to an ending time
- Close Direction: Choose to close only the longs, shorts, or both
- Date Filter: Take the signals from a starting date to an ending date
- Set the maximum losing streak length with an input
- Set the maximum winning streak length with an input
- Set the maximum consecutive days with a loss
- Set the maximum drawdown (in % of strategy equity)
- Set the maximum intraday loss in percentage
- Limit the number of trades per day
- Limit the number of trades per week
- Stop-loss: None or Percentage or Trailing Stop Percentage or ATR - I'll add shortly multiple options for the trailing stop loss
- Take-Profit: None or Percentage or ATR - I'll add also a trailing take profit
- Risk-Reward based on ATR multiple for the Stop-Loss and Take-Profit
Special Thanks
Special thanks to @JosKodify as I borrowed a few risk management snippets from his website: kodify.net
Best
Dave

Polaris [Loxx]Polaris is a lower timeframe, high-leverage scalping indicator. It works by scanning for volatility spikes and then calculation the likelihood that those spikes will break market structure to the upside or downside.
Settings
Volatility Type: ATR or TRD , these types will be expanded in future releases.
Volatility Multiplier: How much volatility for market structure break
Filter and source: Proprietary moving average filter period and source type
Equity Calculation Method: Fixed or compounded. This determines trade size. If fixed, then the strategy uses the same quantity per trade, if compounded the strategy uses a percentage of cash on hand as that cash grows or shrinks
% Risk Per Trade: How much you'd like to risk per trade.
Leverage Multiple: How much leverage you'd like to use
% Maintenance Margin: You can find this value posted on the exchange you use
Enabled Forced Liquidation Stop-loss?: If enabled, the strategy will liquidate at measures of leverage automatically. 10x leverage liquidates at 10% opposite move for the trade, for example. This number will be adjusted by the % Maintenance Margin determined by the exchange.
% Minimum Take Profit Cutoff: This controls whether you wish to take trades only over XX% volatility . Since this indicator is to be used for small tight scalps, this keeps you out of trades that are too small to be useful for your desired trading style
Activate Long Pullback Rule?: This controls how the trade is entered. If activated, then the entry won't occur until a pullback happens after market structure break
Activate Short Pullback Rule?: This controls how the trade is entered. If activated, then the entry won't occur until a pullback happens after market structure break
Activate Trend Flip Exits?: Force strategy to exit when trend flips from short to long and long to short
Number of Take Profits: How many take profits levels. 1-5
Activate Trailing Take Profit?: Allows you to set a trailing stop loss after TP2 his hit
Trailing Take Profit Offset Multipler: This determines when the trailing stoploss hits. It's a multiple of volatility
Activate Moving Stop-loss?: Forces the stop loss to move up as targets are reached
Where to Move Stop-loss: At which Take Profit level do we begin to move stoplosses upward with targets
Show dip buying levels: If you have a high risk appetite, these are levels where you could increase your investment size, this has no effect on the strategy but is included for if you wish to manually add to your position size
Activate Longs?: Toggles on/off Longs
Activate Longs?: Toggles on/off Shorts
The remaining settings are multiples of volatility for Take Profits and dip buying levels
UI components
Big green and red plus signs means an entry point. PTF with green and red arrows means "prepare for trend flip". Not every PTF will actually flip the trend. These are just warning shots to make you aware that a possible trend flip is coming. Labels nest to market structure breaks with numbers are the ideal entry level. You can set limit orders at these levels so as to incur less exchange fees on Binance or Bybit for example. The data window provides useful information about the current trade and targets and stoploss of the next upcoming trade giving the current price action of the asset.
Other things to note
this is an extremely high risk strategy depending on how you tune the settings. You can tune down the settings to make it less risky at the cost of profit and hit rate, but that's up to you and your trading style. This can be used all all timeframes, but is meant for timeframes below 4 hours.